
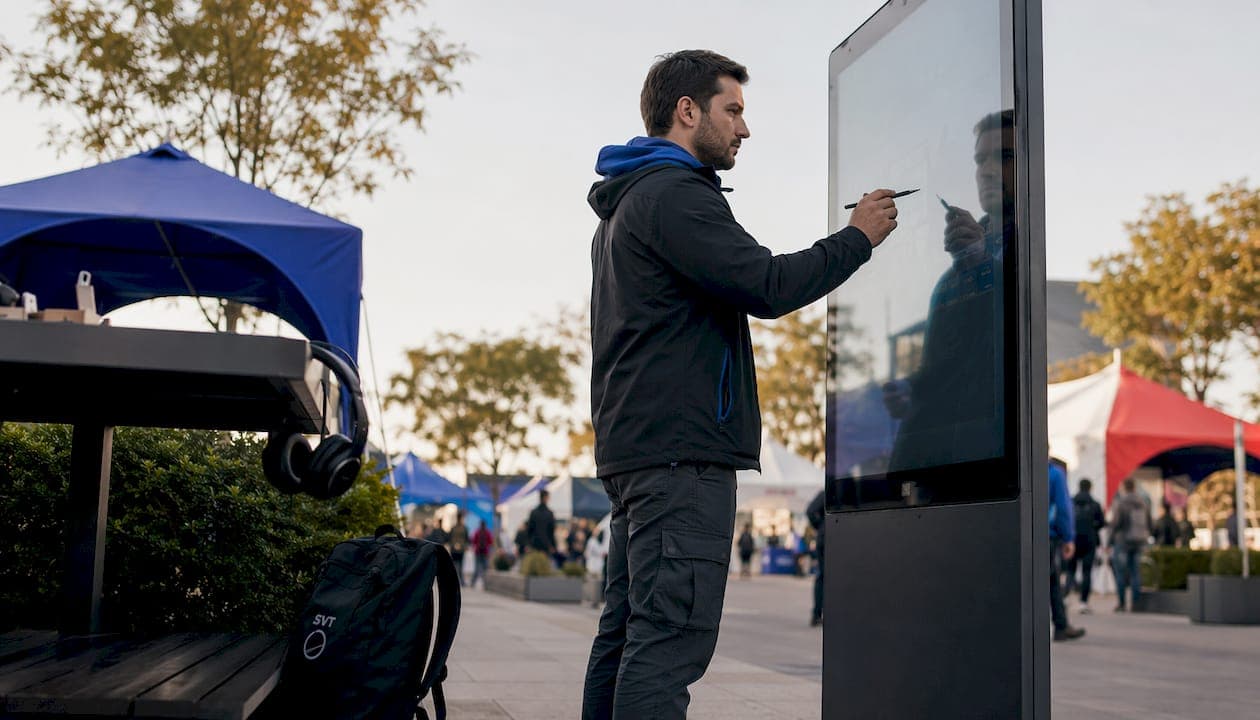
An interactive venue showcase is a spatially mapped interface — a floor plan or 360° tour — connected to real-time data, interaction surfaces, and backend integrations so visitors can explore, configure, and transact directly within the experience.
The five core elements that make any showcase function:
- Mapped layout: a georeferenced floor plan or 360° scene that anchors every interaction to a real physical location
- Interaction surface(s): multi-touch kiosks, touch tables, projectors, or browser-based interfaces
- Data layer and integrations: booking systems, CRM, analytics, and e-commerce APIs
- Content and narrative: guided story arcs, hotspot copy, and media that give the space meaning
- Measurement: dwell time, task completion, and conversion tracking to prove ROI
Research from the University of York identifies participation, narration, and co-presence as the three factors that define engagement in interactive exhibits. NSF-funded research on intelligent science exhibits shows that AI-guided feedback increases both engagement and learning outcomes compared to hands-on exhibits without guidance.
Pro Tip: Before scoping hardware, write one sentence describing what a visitor should be able to do in 90 seconds. Every component decision flows from that sentence.
Table of Contents
- What technical components make an interactive showcase work?
- How do engagement design principles shape the visitor experience?
- Which interaction patterns work best in real venues?
- What does a realistic implementation roadmap look like?
- How should you handle deployment, accessibility, and privacy?
- What KPIs should you track to measure success?
- Key Takeaways
- What most venues get wrong about interactive showcases
- Simple Virtual Tour gives you a practical starting point
- Useful sources and further reading
What technical components make an interactive showcase work?
The hardware, software, and integration layers each carry distinct responsibilities. Getting them right means mapping each component to a specific visitor task.

| Component | Purpose | Recommended spec |
|---|---|---|
| Floor plan engine | Spatial anchor for all interactions | SVG or tile-based, sub-2-second load |
| Multi-touch display | Product config, wayfinding, booking | 55"+ 4K panel, 10-point touch minimum |
| 360°/3D scene renderer | Immersive walkthrough and dollhouse view | WebGL-based, mobile-responsive |
| Analytics layer | Dwell time, heatmaps, funnel tracking | Event-level logging with CRM export |
| Booking/e-commerce API | Seat selection, booth reservation, checkout | OAuth-secured, real-time availability |
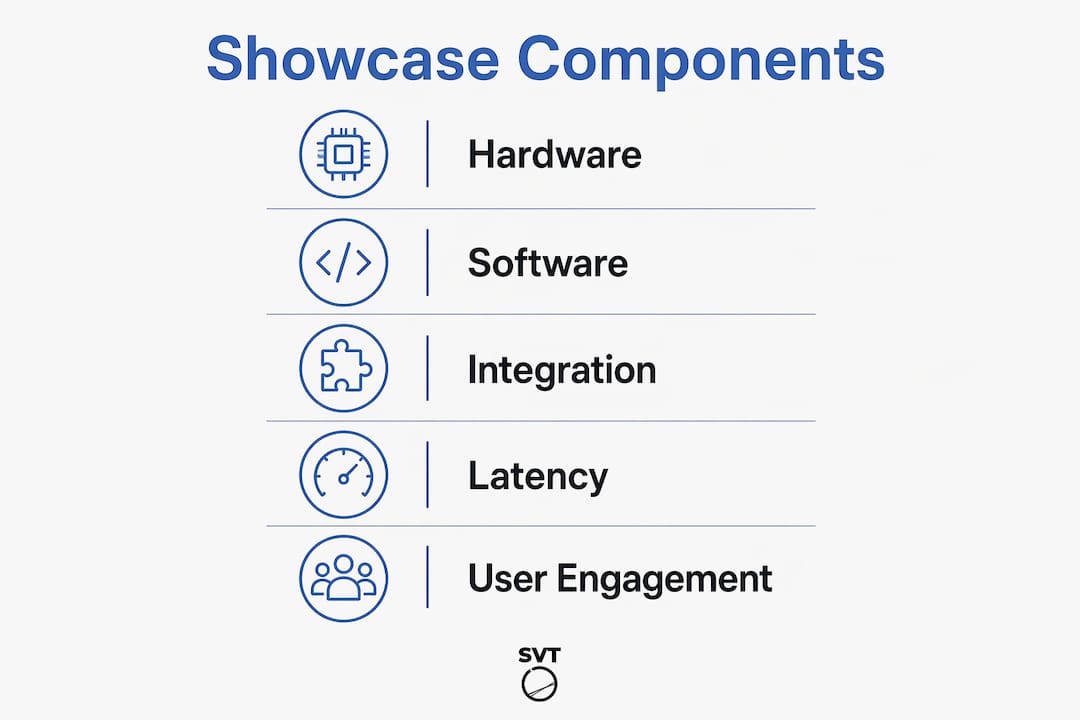
On the software side, you need four layers working together: a spatial model (the floor plan or 360° scene), an interaction layer handling touch and gesture input, a session manager for live guided walkthroughs versus self-service discovery, and a CMS so your content team can update copy and media without developer support. Interactive event floor plans commonly include searchable maps, point-to-point wayfinding, and booth-click flows that open exhibitor profiles and booking options.
Deployment choice shapes everything downstream. Cloud-hosted setups reduce upfront infrastructure cost and simplify remote updates, but they introduce latency risk on congested venue Wi-Fi. Self-hosted deployments give you full data control and predictable performance on a wired LAN, at the cost of on-site server maintenance. A hybrid model — local rendering with cloud-synced analytics and booking — often suits large convention centers best.
"The intuitive simplicity of the UI enhances accessibility, ensuring a user-friendly experience for all." — SEGD project review of the Fellowes Design and Experience Center, a projector-and-token showroom installation that reduced weeks of client negotiations to single sessions.
Pro Tip: Test interaction latency under realistic Wi-Fi load before sign-off. A touch response above 150ms feels broken to users, even if everything else works perfectly.
How do engagement design principles shape the visitor experience?
University of York research on museum exhibit engagement identifies three categories that define whether an interactive works: participation (the visitor acts, not just watches), narration (the visitor constructs and shares a story about what they experienced), and co-presence (others nearby motivate and enrich the experience without requiring explicit collaboration).
Practical rules that follow from those three principles:
- Limit interaction points to one primary task per zone; the Exploratorium's design guidance cautions that overloading interactives with features increases abandonment
- Design for two simultaneous users without conflict — side-by-side touch targets, shared screens, and parallel input modes
- Build entry and exit states into every interactive so visitors know when they have completed a flow
- Balance physical affordances (buttons, tokens, gestures) with verbal ones so pairs can talk while they interact
Research on dyadic interaction shows that exhibits designed to trigger both action and discussion between users produce stronger learning outcomes — and that poor design causes confusion or interference between partners.
The co-presence finding is particularly useful for venue showcases. You do not need to force collaboration; you need to design so that two people standing together do not block or confuse each other.
Pro Tip: Add simple on-screen prompts ("Show your colleague the layout view") to encourage narration without scripting the entire experience.
Which interaction patterns work best in real venues?
The most common patterns in production today are mapped interactive floor plans, multi-touch product configuration tables, projector-driven interactive zones, 360°/VR scene tours, and AI-guided assistance flows. Each fits a different context.
Floor-plan mapping is the workhorse of event venues. Searchable floor maps with point-to-point wayfinding, booth-click flows that open exhibitor profiles, and pre-event bookmarking increase both attendee engagement and exhibitor monetization. A trade show using this pattern typically sees visitors arrive with a planned route rather than wandering.
Touch tables and projector setups dominate showrooms. The Fellowes Design and Experience Center in Chicago used physical material tokens on an interactive table surface connected to a real-time 3D renderer — clients placed an object on the table and saw their configuration visualized instantly, compressing multi-week sales cycles into a single session.
360° and VR scene tours convey scale and flow that photographs cannot. Venues like ICC Sydney offer walkthrough, dollhouse, and directory modes so event organizers can plan remotely before committing to a site visit. Te Pae Christchurch adds floor-plan switching and hotspot details for the same purpose.
Interactive seat maps with 360° previews help ticketed venues close sales. When buyers can preview their sightline before selecting a seat, conversion confidence increases and post-purchase regret drops.
AI-guided assistance is the highest-leverage addition. NSF research found that intelligent exhibits providing real-time feedback on user predictions produce substantially better learning outcomes and longer voluntary dwell times than matched conventional exhibits. For venue showcases, that translates to recommendation paths ("Based on your group size, here are three room configurations") that keep visitors engaged rather than lost. Pairing this with AI-driven demo video tools can extend the guided experience to pre-visit and post-visit touchpoints.
Pro Tip: Physical puck or token interfaces lower the participation barrier dramatically. Visitors who hesitate to touch a screen will readily place an object on a table — and that first action pulls them into the full experience.
What does a realistic implementation roadmap look like?
The sequence is: brief → prototype → pilot → launch → iterate. Each phase has distinct deliverables and stakeholders.
- Discovery (2–4 weeks): Define visitor tasks, map the floor model, audit existing booking and CRM systems, and assign stakeholders. Key players: venue operations, IT/networking, content team, and UX designer.
- Prototype (4–6 weeks): Build a clickable spatial model with one complete interaction flow. Deliverables: mapped floor model, token UI prototype (if applicable), and a draft analytics plan.
- Pilot/testing (2–4 weeks): Run functional, accessibility, load, and privacy/data-flow tests. Invite a small group of real users. The Exploratorium's guidance is direct: simpler interaction points increase completion rates, so use pilot feedback to cut, not add, features.
- Full deployment (1–3 weeks): Coordinate with AV integrator and vendor account manager for hardware installation and network configuration. Embed the tour on your event website for pre-visit access.
- Post-launch iteration (ongoing): Review analytics monthly, A/B test narrative variants, and update content through the CMS without developer involvement.
High-level cost drivers: hardware (displays, projectors), custom 3D modeling and content production, API integration work (booking, CRM), and ongoing hosting or support contracts. As illustrative ranges only: small venue setups typically run $15,000–$40,000 all-in; mid-size event installations range from $40,000–$120,000; large convention-center deployments with custom hardware can exceed $200,000.
Pro Tip: Assign one person as the single point of contact between the AV integrator and the software vendor. Miscommunication between those two teams is the most common cause of launch delays.
How should you handle deployment, accessibility, and privacy?
Choose your deployment mode based on three factors: data control requirements, your team's maintenance capacity, and latency tolerance.
| Dimension | Cloud-hosted | Self-hosted | Hybrid |
|---|---|---|---|
| Data control | Vendor-managed | Full owner control | Shared |
| Cost profile | Subscription-based | Higher upfront, lower ongoing | Moderate |
| Maintenance | Vendor handles updates | In-house IT required | Split responsibility |
| Scalability | Elastic | Hardware-limited | Flexible |
| Best for | Small to mid venues, fast deployment | Large venues, sensitive data | Convention centers, multi-site |
Security checklist before launch: enforce authentication on all admin interfaces, segment the showcase network from general venue Wi-Fi, secure all booking and CRM APIs with OAuth 2.0, document backup and recovery procedures, and confirm vendor SLA response times in writing.
Accessibility checklist (ADA compliance): keyboard navigation for all interactive flows, screen-reader support on browser-based interfaces, WCAG 2.1 AA color contrast on all displays, captions or transcripts for any audio content, and touch targets of at least 44×44 pixels on kiosk screens.
On privacy: aggregate analytics wherever possible, minimize personally identifiable information capture, document data retention and deletion policies before launch, and run a data-flow review with your legal team. Plan remote update capability so content changes do not require on-site visits during active events.
Pro Tip: Schedule a "dark run" — a full rehearsal with staff playing visitors — 48 hours before any public event. It surfaces edge cases that testing environments never catch.
What KPIs should you track to measure success?
Measure both behavior and outcome metrics: dwell time and task completion on the behavior side, bookings and lead capture on the outcome side.
Core KPIs:
- Average dwell time: how long visitors spend at each interactive zone; longer is not always better, but sharp drops signal friction
- Task completion rate: percentage of visitors who finish a defined flow (e.g., booth search → profile view → meeting request)
- Conversion rate: bookings, lead captures, or e-commerce checkouts attributed to the showcase
- Repeat visits: return sessions from the same device or account, indicating sustained interest
- Assisted sales: revenue traced back to showcase interactions via CRM tagging
Measurement methods: event-level analytics for every tap and navigation step, session replay for kiosk flows, CRM integration to connect showcase interactions to closed bookings, and A/B testing for narrative variants. Virtual tour data consistently shows conversion improvements when venues add interactive booking flows to their tour experience.
Combine quantitative data with qualitative feedback: short post-visit surveys and staff observations catch usability issues that analytics alone miss.
Key Takeaways
Interactive venue showcases work when mapped spatial interfaces, focused interaction patterns, and backend integrations operate together as a single, measurable system.
| Point | Details |
|---|---|
| Three engagement factors | Design for participation, narration, and co-presence — all three must be present for strong engagement. |
| Limit interaction points | Fewer, stronger interactions outperform feature-heavy setups; pilot feedback should cut, not add, features. |
| Deployment choice matters | Choose cloud, self-hosted, or hybrid based on data control needs, maintenance capacity, and latency tolerance. |
| Measure behavior and outcomes | Track dwell time and task completion alongside bookings and lead capture to prove ROI. |
| Simple Virtual Tour fits here | Simple Virtual Tour supports mapped layouts, live guided sessions, booking integration, and both cloud and self-hosted deployments. |
What most venues get wrong about interactive showcases
The single most common mistake is skipping the pilot phase and assuming the technology will scale without user testing. Every project I have reviewed that launched without a real-user pilot needed significant rework within 60 days — usually because the narrative flow made sense to the design team but confused actual visitors within the first 30 seconds.
Three mistakes that appear repeatedly, and their fixes:
- Overloaded features: teams add interactions because they can, not because visitors need them. Fix: define one primary task per zone and remove everything that does not serve it.
- Ignoring co-presence design: the interactive works for one person but creates conflict when two people use it simultaneously. Fix: test every flow with two users side by side before sign-off.
- Insufficient analytics: teams track page views but not task completion or conversion. Fix: instrument every interaction point from day one, not as an afterthought.
Physical token or puck interfaces deserve more attention than they typically get. Visitors who hesitate at a touchscreen will engage immediately when they can place a physical object and see a result — it removes the fear of "breaking something" and pulls hesitant users into the full experience.
Simple Virtual Tour gives you a practical starting point
If you are planning an interactive venue showcase and want a platform that handles the technical complexity without requiring a custom build from scratch, Simple Virtual Tour is worth a close look. It supports mapped floor-plan layouts, 360° scene tours, live guided sessions, and e-commerce or booking integrations — covering the core components this article describes, in both cloud-hosted and self-hosted configurations.
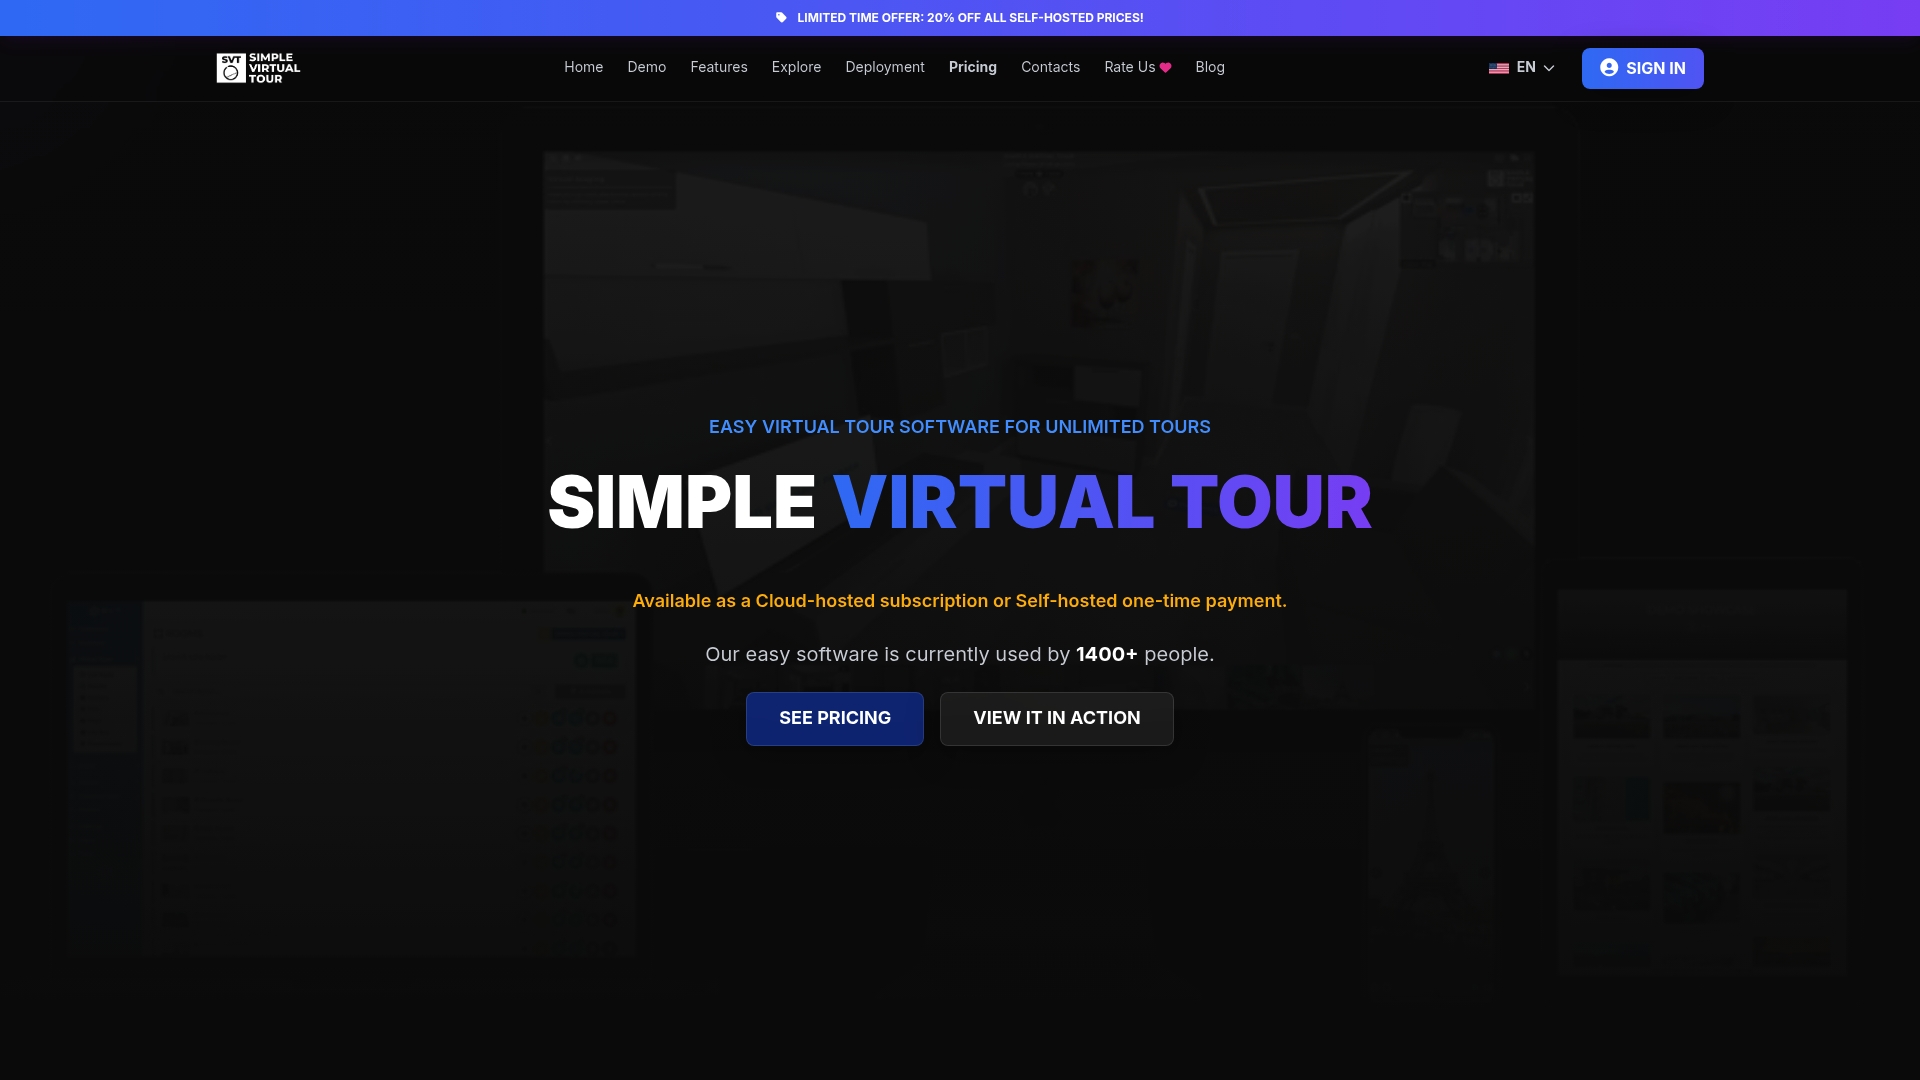
A venue sales team, for example, can build a 360° floor-plan tour with clickable room hotspots linked directly to a booking calendar. Prospective clients explore the space remotely, select a room configuration, and complete a reservation without a single in-person site visit. That flow reduces the sales cycle and frees your team for higher-value conversations. Simple Virtual Tour's intuitive backend means your content team can update copy, swap media, and add new hotspots without developer support. With over 1,400 current users and unlimited tour creation, the platform scales from a single showroom to a multi-venue portfolio. See the plans and start a demo to evaluate whether it fits your project scope.
Useful sources and further reading
- NSF: Intelligent Science Exhibits — primary research on AI-guided exhibit engagement and learning outcomes
- University of York: Engagement with an Interactive Museum Exhibit — foundational study on participation, narration, and co-presence
- Journal of Research in Science Teaching: Dyadic interaction research — evidence for designing exhibits that support two-user interaction
- Exploratorium: Designing with Interactives (PDF) — practitioner guidance on scope control and interaction design
- Mapsted: Interactive event floor plan software — overview of floor-map features in production event tools
- ICC Sydney 360° interactive tour — live example of walkthrough, dollhouse, and directory modes
- Te Pae Christchurch 360° interactive tour — example of floor-plan switching and hotspot navigation
- SEGD: Fellowes Design and Experience Center — showroom case study using projector and token interaction
- Simple Virtual Tour blog: Venue showcase digital tools — product-specific guidance on digital floor plans and live data integration
- Simple Virtual Tour blog: Live virtual venue tour hosting — guidance on live guided sessions and session management
- Simple Virtual Tour: Main product page — feature overview including deployment options, booking integration, and unlimited tour creation