

A student engagement checklist for online courses gives you a structured, repeatable way to spot disengagement before it becomes a failing grade. Copy the quick-scan checklist below into your LMS announcement, observation form, or weekly notes document, then use the full template in the next section for deeper tracking.
Quick-scan checklist (paste into your LMS or doc):
- Logged in at least twice this week
- Submitted all graded tasks on time
- Posted at least one substantive discussion reply
- Attended or watched the recording of synchronous sessions
- Responded to instructor feedback promptly
- Participated in at least one group or breakout activity
Pro Tip: Have your TA run this six-item scan every Monday morning using LMS activity reports. Flag any student who misses two or more items for a same-week check-in message.
Key Takeaways
A reliable student engagement checklist for online courses combines observable behavioral indicators with a structured administration workflow and clear intervention triggers.
Key points include running weekly quick scans using LMS activity reports to catch disengagement early, matching checklist detail to the observer's role, tying items to RSI and quality frameworks for accreditation support, acting promptly on red flags such as missed tasks or lack of attendance, and using platforms that support interactive engagement activities in courses.
Table of Contents
- What does a full student engagement checklist online look like?
- What are the core engagement dimensions to observe online?
- How do you apply the checklist at classroom, course-design, and program levels?
- How should you administer, score, and interpret the checklist?
- Which online indicators and tools capture engagement most reliably?
- Where can you find high-quality online checklist templates?
- How do you act on low checklist scores?
- How do you adapt checklists for K–12, higher ed, and students with disabilities?
- Why do these checklist items matter? Research and framework alignment
- What experienced online educators know that checklists alone cannot teach
- Simple Virtual Tour supports interactive online engagement
- Sources
What does a full student engagement checklist online look like?
A complete online engagement checklist organizes observable behaviors into trackable sections. The Online Course Quality Checklist from St. Edward's University identifies early participation opportunities, timely feedback, and aligned activities as the backbone of any quality online course, and those same categories translate directly into a practical observation form.
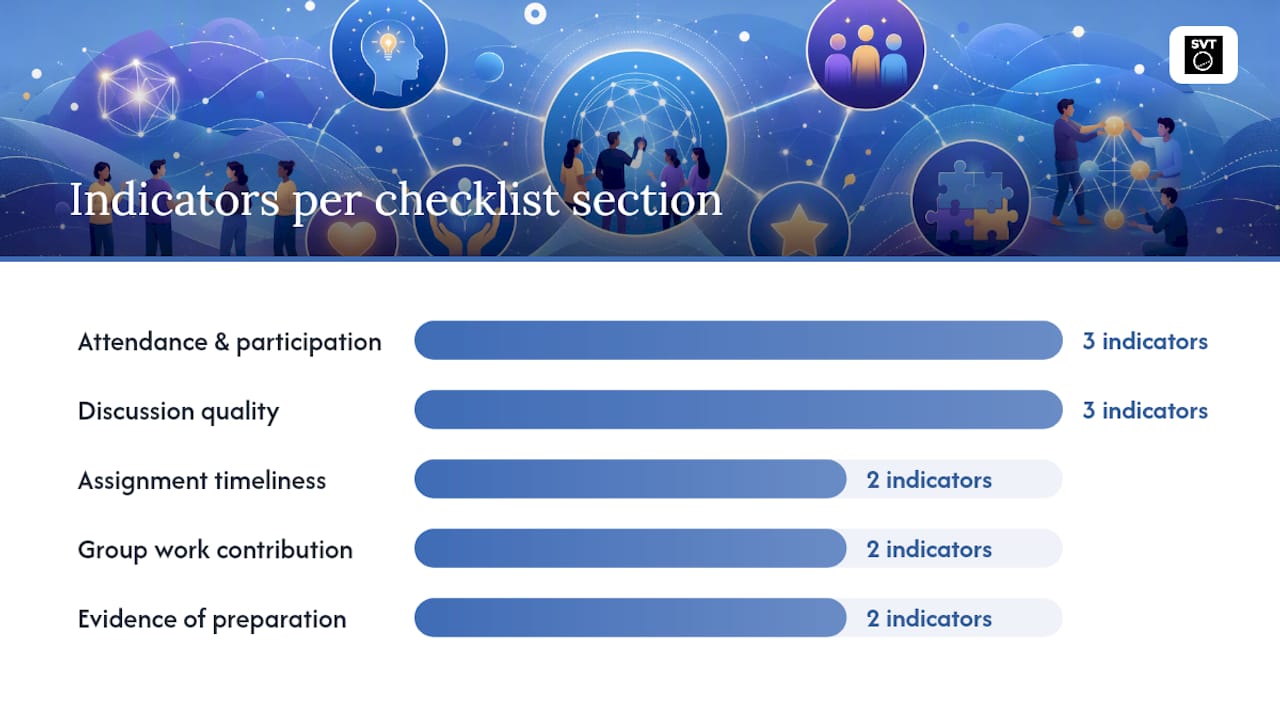
Checklist sections and sample indicators:
- Attendance and synchronous participation: Attended live session; joined breakout room; used chat or polling tool
- Discussion quality: Posted original thread by the due date; replied substantively to at least two peers; used evidence or examples
- Assignment timeliness: Submitted all graded work on or before the deadline; resubmitted corrected work within the allowed window
- Group work contribution: Took an assigned role in collaborative tasks; contributed at least one documented comment or file
- Evidence of preparation: Referenced assigned readings or materials in posts; asked questions that show prior engagement with content
Sample data fields for your observation form:
| Field | Example entry |
|---|---|
| Student name | Jordan M. |
| Date of observation | March 10, 2026 |
| Activity observed | Week 4 discussion board |
| Indicators checked | On-time post ✓, Peer reply ✓, Evidence cited ✓ |
| Quick notes | Strong synthesis; no synchronous attendance this week |
Scoring options: Use a binary (present/absent) mark for infrastructure items like submission and login. For quality items like discussion depth, a 1–5 scale works better. The Online Learning Engagement Guide from Appalachian State recommends a three-tier rubric (fully engaged, somewhat engaged, not engaged) that maps cleanly to a 3-point scale if you prefer fewer gradations.
To embed this in your LMS, create an assignment with a rubric attached, or build it as a Google Form that auto-populates a spreadsheet. The Instructor Tool: Student Participation and Engagement Tracker includes ready-made tracking forms, discussion quality rubrics, and LMS integration tips you can adapt without starting from scratch.
What are the core engagement dimensions to observe online?
Engagement researchers typically organize observable behaviors into three dimensions. Each one requires different indicators in an online setting.
Behavioral engagement covers the actions you can count: logins, submissions, posts, and attendance. Observable indicators include on-time submission of graded work, login frequency across the week, number of discussion posts, and attendance at synchronous sessions. These are the easiest to document with LMS analytics.
Emotional engagement reflects motivation and belonging. Online, you look for: voluntary participation in optional activities, positive or constructive tone in discussion posts, use of instructor office hours, and peer-to-peer encouragement in group spaces. These signals are harder to automate, so brief weekly notes from the instructor or TA matter here.
Cognitive engagement shows depth of thinking. Indicators include: posts that cite course materials or outside sources, questions that go beyond surface recall, peer replies that extend or challenge an argument, and multimedia submissions that demonstrate synthesis. The Essential QA Checklist for Online Course from George Mason University groups 42 indicators across presence, interaction, and community, and cognitive depth items appear throughout the interaction and community sections.
Sample rubric items you can paste directly:
- "Student's discussion post cites at least one course reading with a page or timestamp reference." (Cognitive)
- "Student used the chat or reaction feature during the live session." (Behavioral)
- "Student's reply to a peer adds a new example or a counterpoint." (Cognitive/Emotional)
Pro Tip: In week 1, post a low-stakes "introduce yourself" discussion with a specific prompt (share one goal and one concern). Students who skip it are your earliest disengagement signal, and it costs them nothing to complete. Scaffolding that first participation opportunity is one of the highest-leverage moves you can make.
How do you apply the checklist at classroom, course-design, and program levels?
The same checklist items serve different purposes depending on who is completing them and why. Matching the right scope to the right observer prevents both under-use and data overload.
Classroom observation is the most frequent use. The instructor or TA reviews individual student behavior weekly or bi-weekly. Binary checkboxes (did the student post? yes/no) work well here because speed matters and the data feeds direct outreach.
Course-design audit happens before or at the start of a term. An instructional designer or department chair reviews whether the course structure itself creates engagement opportunities: Are there early participation activities? Is feedback promised within a stated window? Does the syllabus explain how participation is graded? Scale ratings (1–5) fit this level because you are judging quality and completeness, not a binary presence.
Program or institutional review uses aggregated checklist data across sections to identify systemic gaps. A dean or assessment coordinator might look at whether all online sections meet the same participation standards. Binary items (infrastructure present/absent) and averaged scale scores both appear here.
| Item type | Binary checkbox | Rating scale (1–5) |
|---|---|---|
| Submission received | ✓ Best fit | Not needed |
| Discussion post quality | Acceptable for quick scan | ✓ Best fit |
| Course has early participation activity | ✓ Best fit | Not needed |
| Instructor feedback timeliness | ✓ Best fit | ✓ Also useful |
| Depth of peer interaction | Not sufficient | ✓ Best fit |
How should you administer, score, and interpret the checklist?
A reliable workflow removes the guesswork from who does what and when. Here is a practical sequence:
- Week 1 baseline scan: Instructor or TA checks login activity and completion of the introductory activity for every enrolled student. Flag anyone who has not logged in by day 5.
- Weekly quick scan (10–15 minutes): TA reviews LMS activity reports against the six-item checklist from the opening section. Log results in a shared spreadsheet.
- Mid-term audit (week 6–8): Instructor reviews cumulative scores. Students with two or more "not engaged" ratings across any dimension receive a structured outreach message and a scaffolded catch-up plan.
- End-of-term summary: Aggregate scores feed into a participation grade and a section-level report for the department. The plan-document-complete workflow in the participation tracker toolkit includes heat maps and weekly summaries that let you spot whole-cohort problems early.
- Scoring interpretation: A student scoring "present" on fewer than half the behavioral items in any given week is a moderate-risk flag. Two consecutive weeks at that level triggers a documented intervention.
Observer roles: The instructor owns the mid-term audit and end-of-term summary. A TA handles the weekly quick scan. A peer observer or instructional designer conducts the course-design audit once per term.
Pro Tip: Set up a conditional-formatting rule in Google Sheets so any cell that drops below a threshold score turns red automatically. You will spend less time scanning rows and more time acting on the students who need you.
Which online indicators and tools capture engagement most reliably?
Platform signals map directly to checklist indicators, and knowing which tool captures which signal saves you from manual tracking.
| Engagement indicator | Tool or feature that captures it |
|---|---|
| Login frequency | LMS activity log (Canvas, Blackboard, Moodle) |
| Time-on-task | LMS page-view duration reports |
| Discussion post quality | Discussion export + manual rubric review |
| Synchronous participation | Zoom attendance report or LMS attendance tool |
| Breakout-room activity | Zoom breakout session logs; facilitator notes |
| Submission timeliness | LMS gradebook submission timestamps |
| Live polling responses | Mentimeter or Wooclap export reports |
| Multimedia submissions | LMS assignment submission type filter |
Live-polling platforms like Mentimeter and Wooclap produce exportable participation data from anonymous quizzes, word clouds, and live Q&A sessions, giving you a behavioral signal from students who rarely speak up in discussion boards. Wooclap's 20-plus activity types integrate directly with several LMS gradebooks, so responses can flow into your tracker without manual entry.
The most reliable approach combines automated analytics with brief human observation notes. Pull the LMS report for behavioral data, then add a one-line qualitative note per student per week for emotional and cognitive signals. That combination is what the digital engagement strategies literature consistently identifies as the most complete picture of participation.
Where can you find high-quality online checklist templates?
Several authoritative sources offer ready-made templates you can adapt without building from scratch.
- University of Tennessee's EOCR Checklist (download PDF): Documents regular and substantive interaction items; ideal for accreditation-focused programs.
- George Mason University's Essential QA Checklist (download PDF): 42 indicators across instructor presence, interaction, and community; printable and LMS-adaptable.
- Northern Illinois University's Standard 6 Checklist (view online): Focused on engagement and learner interaction; useful for course-design audits.
- Council for Exceptional Children's Activity Participation Checklist (view online): Designed for K–5 and special-education contexts; adaptable for any grade level.
To convert a PDF checklist into a Google Form, open Google Forms, add one question per checklist item, and set the response type to checkbox (binary) or linear scale (1–5). Import the resulting spreadsheet into your LMS gradebook or tracker.
How do you act on low checklist scores?
Low scores are only useful if they trigger a clear next step. Here is a short intervention workflow:
- Identify the red-flag threshold. A student who misses three or more graded tasks, or who has had no synchronous attendance for two consecutive weeks, meets the threshold for immediate outreach.
- Send a direct, specific message. Reference the exact missed items ("I noticed you haven't posted in the week 5 discussion"). Avoid generic "checking in" language, which students often ignore.
- Offer a scaffolded catch-up activity. Provide a shorter, alternative version of the missed task or a one-on-one office-hours slot to rebuild momentum.
- Connect to academic support resources. Refer the student to tutoring, writing centers, or disability services as appropriate. The Check & Connect program from the University of Minnesota provides a structured monitoring and intervention model that many institutions have adopted for exactly this workflow.
- Document every outreach attempt. Record the date, method (email, LMS message, phone), the student's response, and the agreed next step. This documentation supports early-alert systems and protects the institution if a student later disputes their grade.
Red-flag criteria for immediate action: no login in seven or more days, missing two or more consecutive graded submissions, or a sudden drop from "fully engaged" to "not engaged" across multiple dimensions in a single week.
How do you adapt checklists for K–12, higher ed, and students with disabilities?
Indicators that work for a graduate seminar do not translate directly to a third-grade Zoom class. Adjusting scope and language makes the checklist accurate rather than aspirational.
K–12 adaptations:
- Replace "substantive peer reply" with "typed or recorded response to a classmate's post."
- Track on-camera readiness and task completion rather than synthesis depth.
- Use a 3-point scale (not yet, almost, yes) instead of a 1–5 scale.
- The Council for Exceptional Children's Activity Participation Checklist provides elementary-level templates and paraprofessional-friendly formats that require minimal modification.
Higher education adaptations:
- Add indicators for evidence of synthesis: "Post references at least two sources beyond the assigned reading."
- Track peer-review quality and self-assessment accuracy alongside instructor observation.
- Use the full 1–5 scale and weight cognitive indicators more heavily in the participation grade.
Accessibility adjustments:
- Add checklist items for captioning availability, alternative format submissions (audio, video, text), and flexible deadline accommodations.
- Score participation on effort and completion rather than format when a student has a documented accommodation.
- Adjust intervention timelines: a student with a chronic health condition may need a two-week rather than one-week response window before a red flag is triggered.
Pro Tip: Contact your institution's disability support office during course design, not after a student requests accommodations. They can review your checklist indicators and flag any that inadvertently penalize students with documented needs, saving you a mid-term redesign.
For guidance on building accessible interactive content alongside your checklist, the virtual tour accessibility features guide covers practical setup steps that apply equally well to any embedded digital activity.
Why do these checklist items matter? Research and framework alignment
The checklist items in this article are grounded in two converging bodies of evidence: federal regular and substantive interaction (RSI) requirements and recognized online course quality frameworks.
RSI is a federal requirement for online courses that receive Title IV funding. Checklists that document instructor feedback, prompted discussion posts, and structured peer activities directly support RSI compliance. The University of Tennessee's EOCR Checklist was built specifically to help programs demonstrate RSI with observable, documented evidence.
Quality frameworks like the George Mason QA Checklist and the NIU Standard 6 Checklist align with this requirement by specifying observable indicators across instructor presence, interaction, and community. Blended rubric approaches, where students self-assess alongside instructor observation, produce richer signals than instructor-only data, as the Appalachian State engagement guide documents.
Key sources that informed this checklist:
- UT Knoxville EOCR Checklist (RSI documentation)
- St. Edward's University Online Course Quality Checklist (course design and early participation)
- George Mason University Essential QA Checklist (42-indicator framework)
- Appalachian State Online Learning Engagement Guide (rubric-style self-assessment)
- Business Communication Network Participation Tracker (workflow and automation templates)
Privacy note: Observation data collected through LMS analytics or instructor forms should be stored in your institution's secure systems, accessible only to the instructor of record, the TA, and designated academic support staff. Retention periods typically follow your institution's FERPA-compliant records policy.
What experienced online educators know that checklists alone cannot teach
Most engagement checklists measure what students do. The harder question is why they stop doing it, and that answer rarely lives in the LMS data.
After working through the research behind these frameworks, one pattern stands out: the educators who use checklists most effectively treat them as conversation starters, not scorecards. A student who drops from "fully engaged" to "not engaged" in week 6 is not a data point to flag and forward to advising. They are someone whose circumstances changed, and the checklist's job is to surface that change fast enough for a human to respond.

The frameworks here, from the UT EOCR Checklist to the Appalachian State engagement guide, all point toward the same design principle: build the first-week participation activity so that completing it is easier than skipping it. A low-stakes, specific prompt in week 1 does more for your end-of-term engagement scores than any mid-term intervention, because it identifies the students who need support while there is still time to provide it. Pair that with a weekly six-item scan and a clear red-flag threshold, and you have a system that is both manageable and meaningful.
For educators exploring how interactive digital environments can support that first-week engagement, the virtual tour engagement strategies resource offers concrete examples of embedding interactive activities alongside your checklist workflow.
Simple Virtual Tour supports interactive online engagement
Tracking engagement is only half the work. The other half is giving students something worth engaging with.
Simple Virtual Tour gives educators a platform to build interactive, live-session-ready environments that pair directly with the checklist indicators covered in this article. Instead of a static slide deck, you can embed 360° panoramas, multimedia hotspots, and live session capabilities into your course, creating the kind of participation opportunities that behavioral and cognitive engagement indicators are designed to measure. The platform supports both cloud-hosted and self-hosted deployment, so your institution keeps control of its data. Over 1,400 users already use it to present spaces and run live digital sessions without needing technical expertise. If you are ready to add interactive environments to your online course, start with Simple Virtual Tour and see how quickly your engagement data changes.